DATA VISUALIZATION
INFORMATION DESIGN
INFOGRAPHIC
CONTEXT
In this project for the final subject of synthesis and with future publication in the newspaper Corriere Della Sera (La Lettura). We wanted to visualize the information after doing exploration and breakdown of data, statements, and issues having as a starting point a controversial issue like climate change
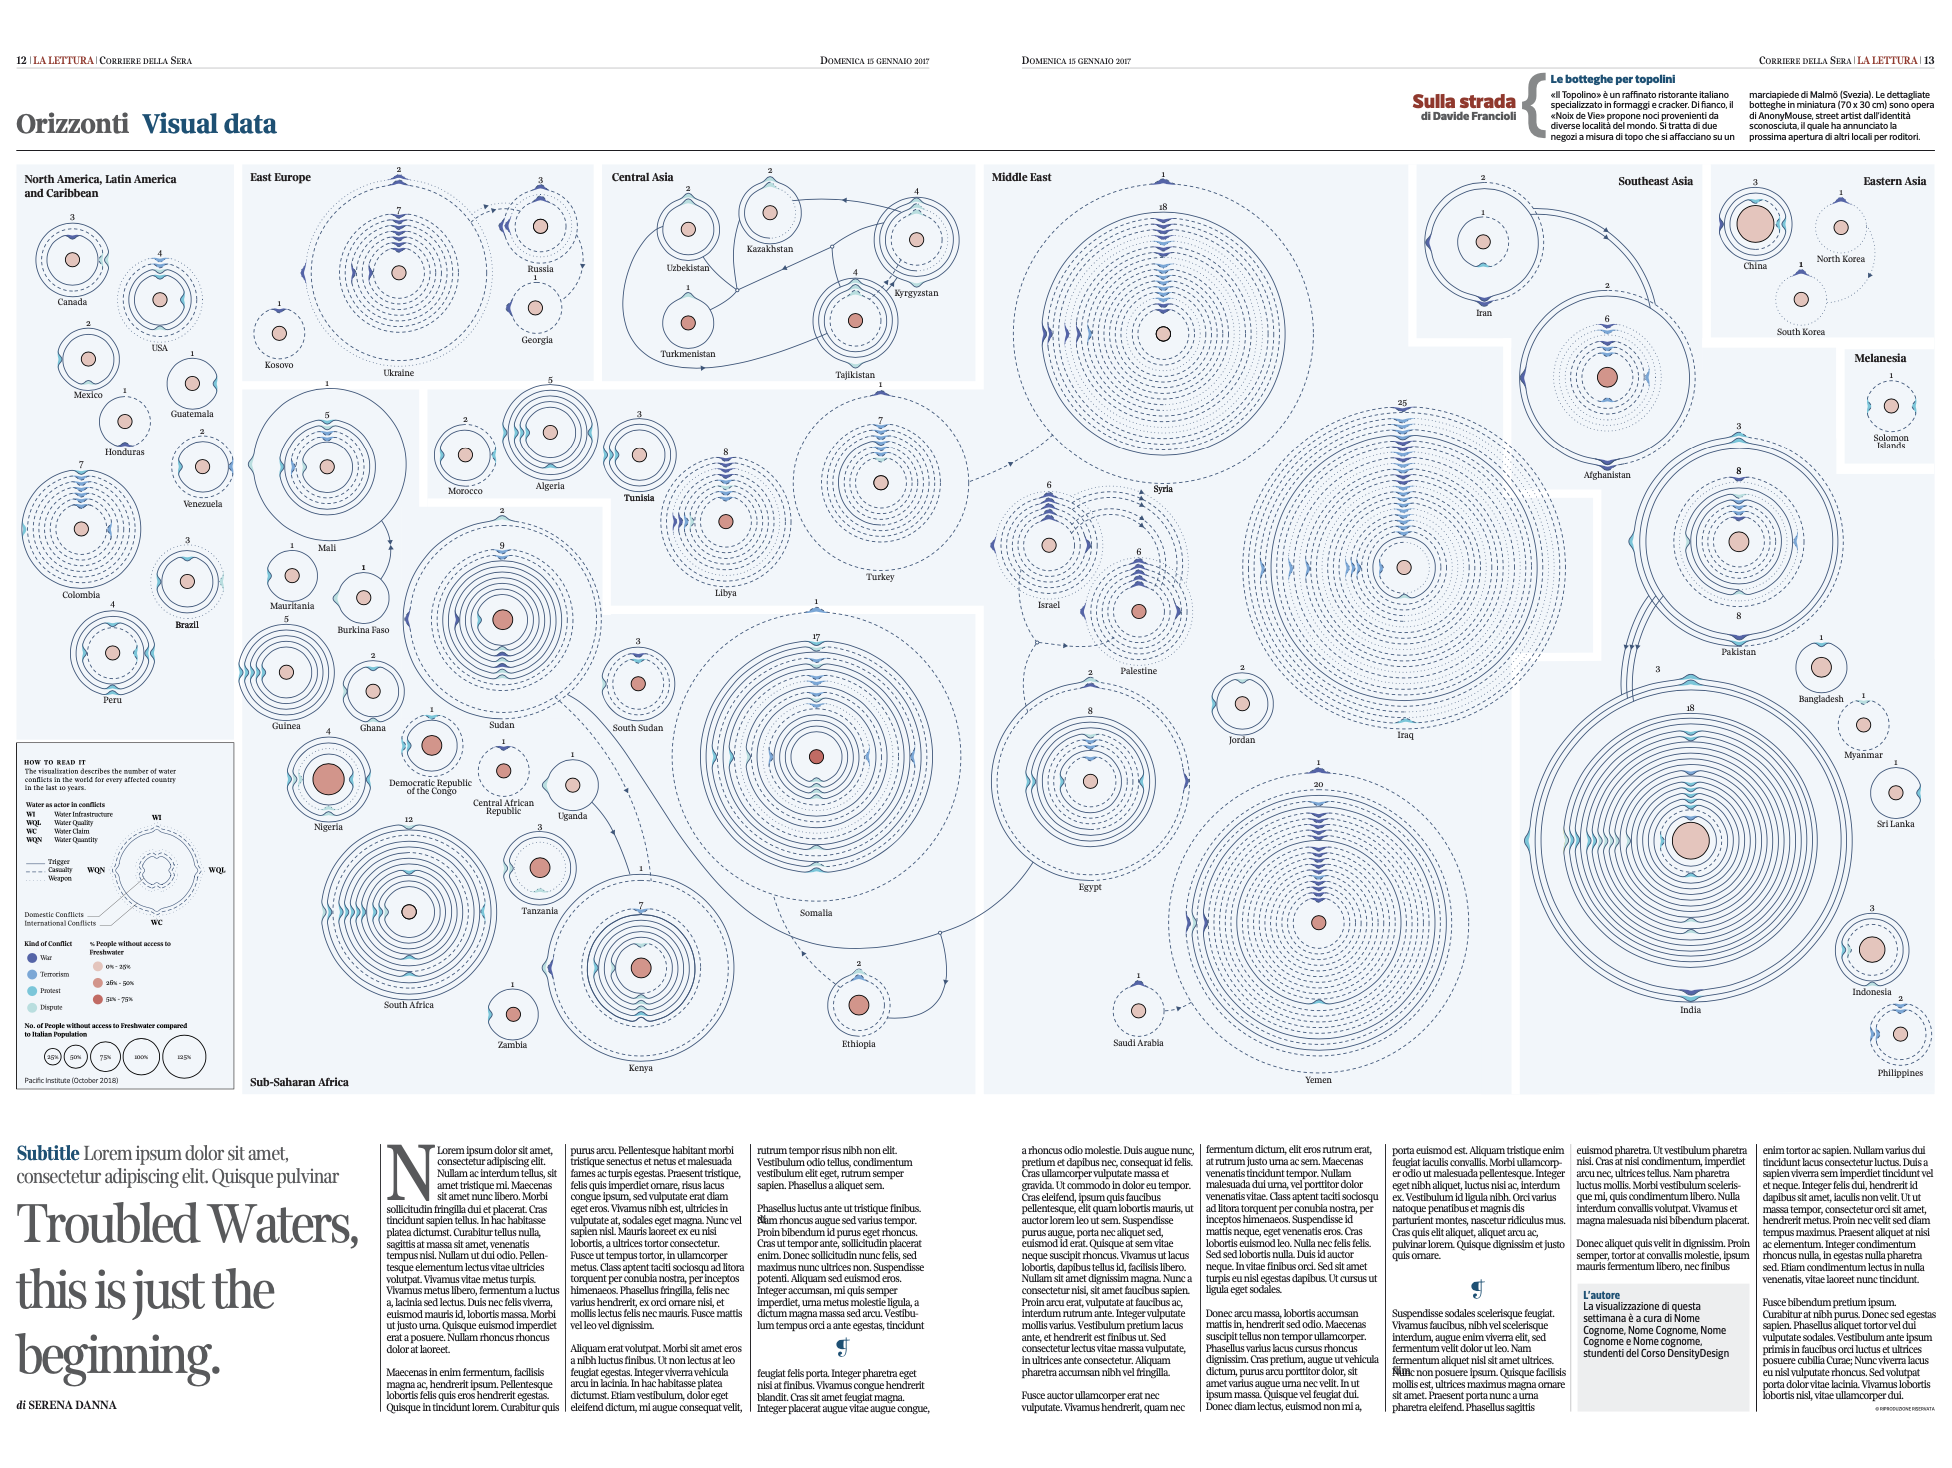
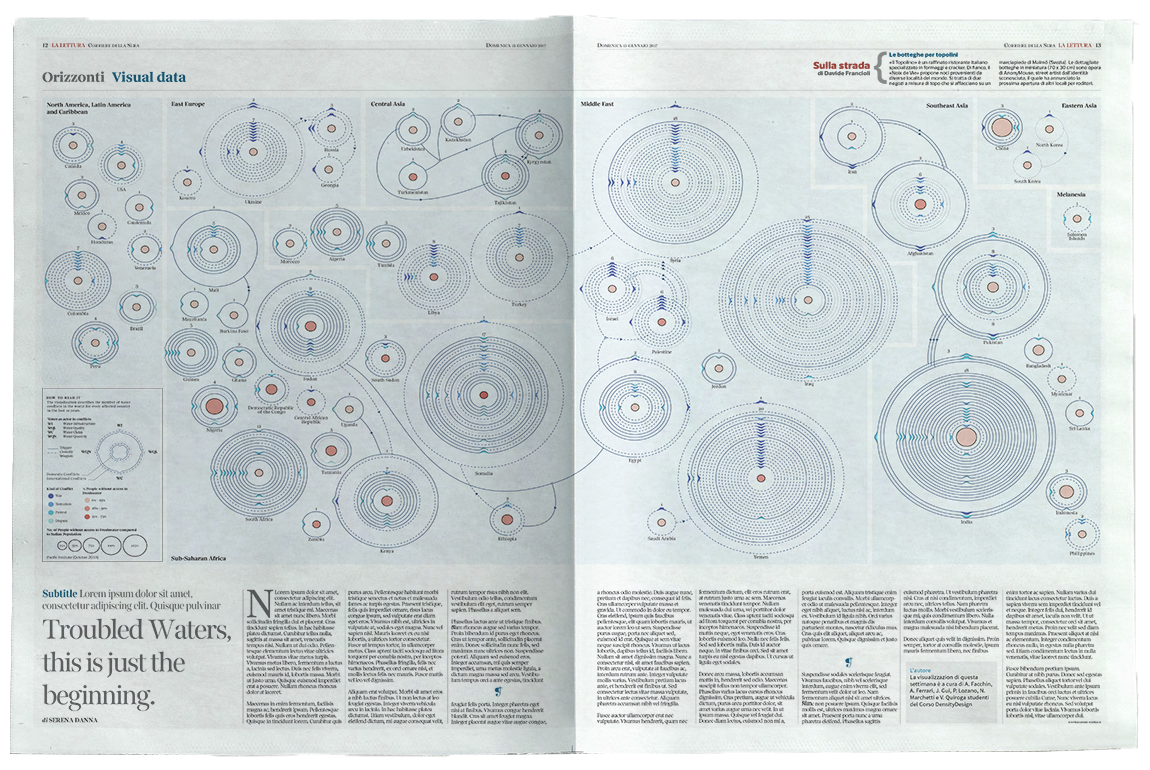
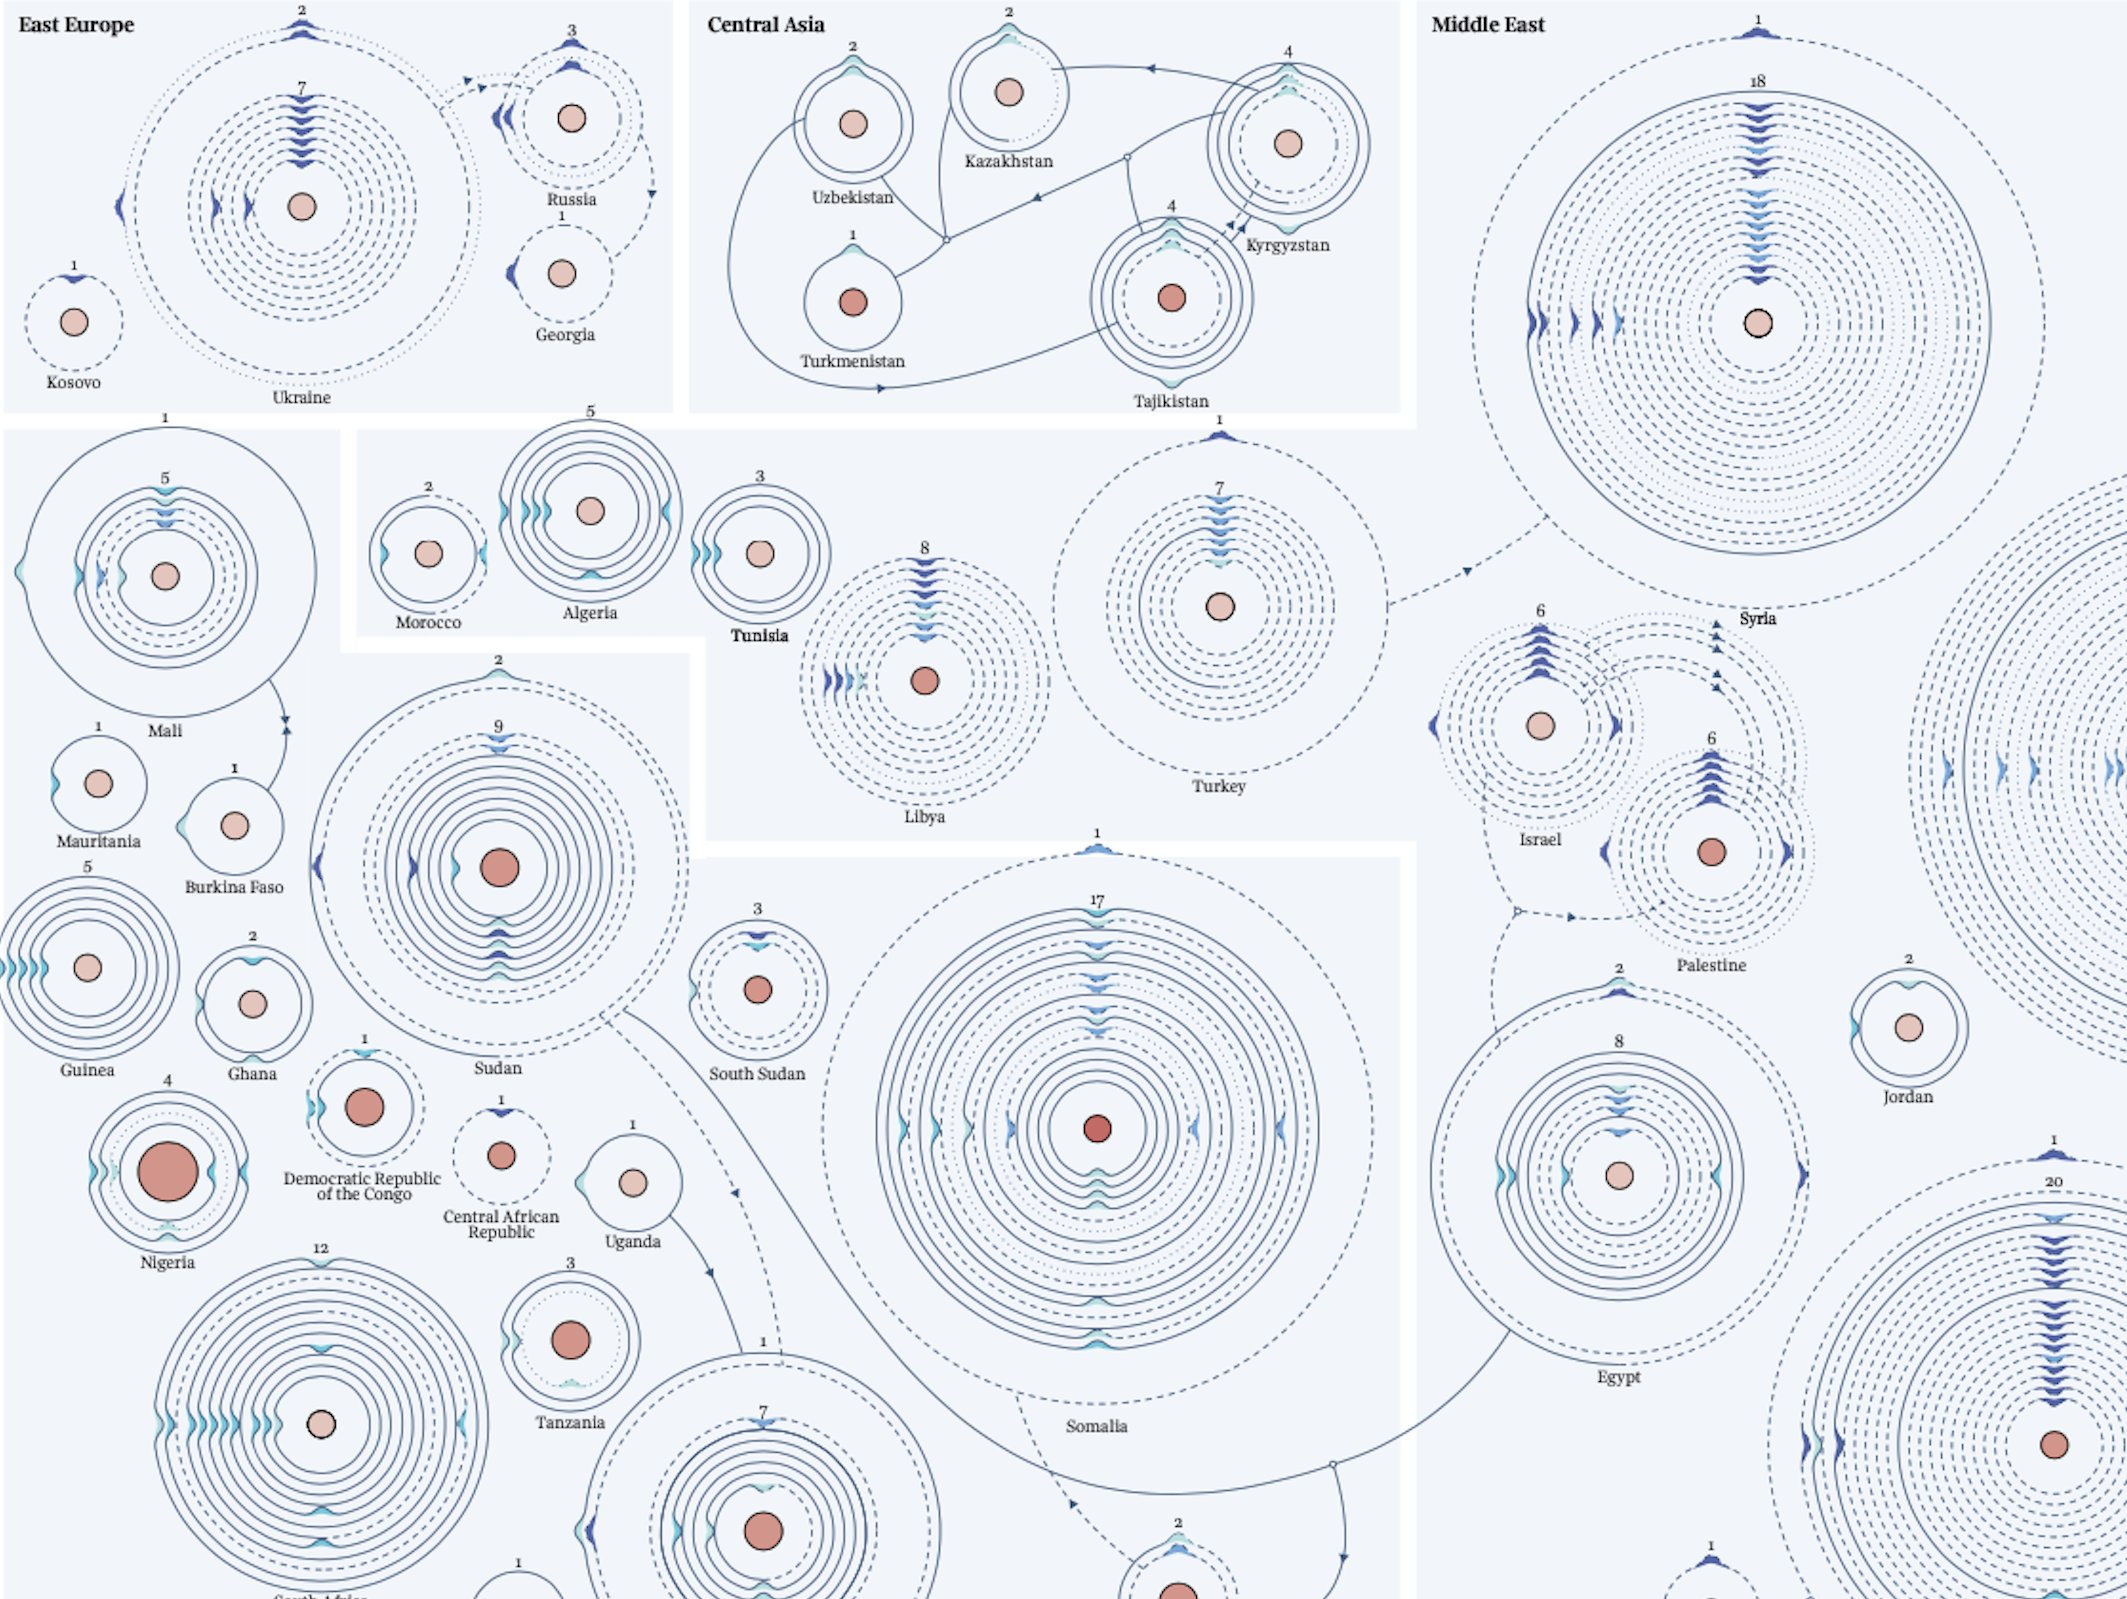
As a global problem, internal and external conflicts arise between countries, which further damages social stability and development in some areas. The war over water over time has been constant in the same countries, it is the starting point for multiple conflicts so that this water resource is necessary to survive.
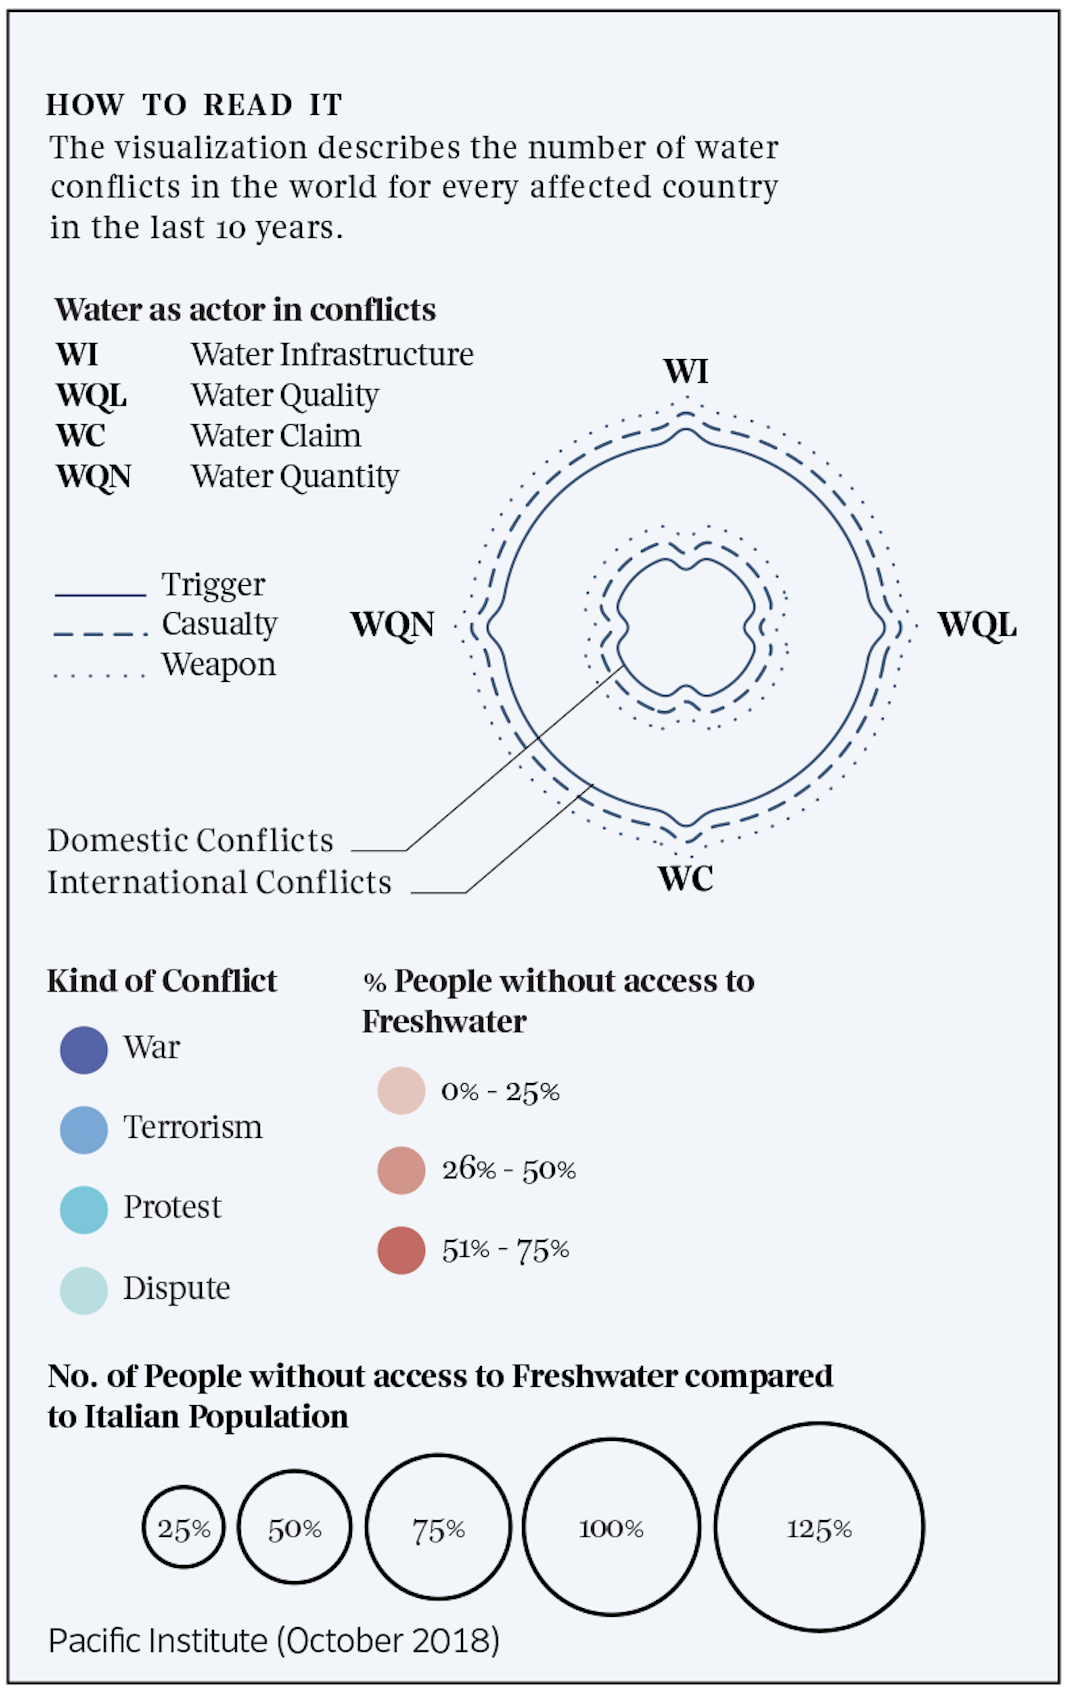
For the development of the visualization, it was necessary to take into account the timeline and the characteristics of the conflicts around the water, the crossing of this additional information to the data on access to drinking water, it was indispensable to give this storytelling of whole this information.
PROCESS
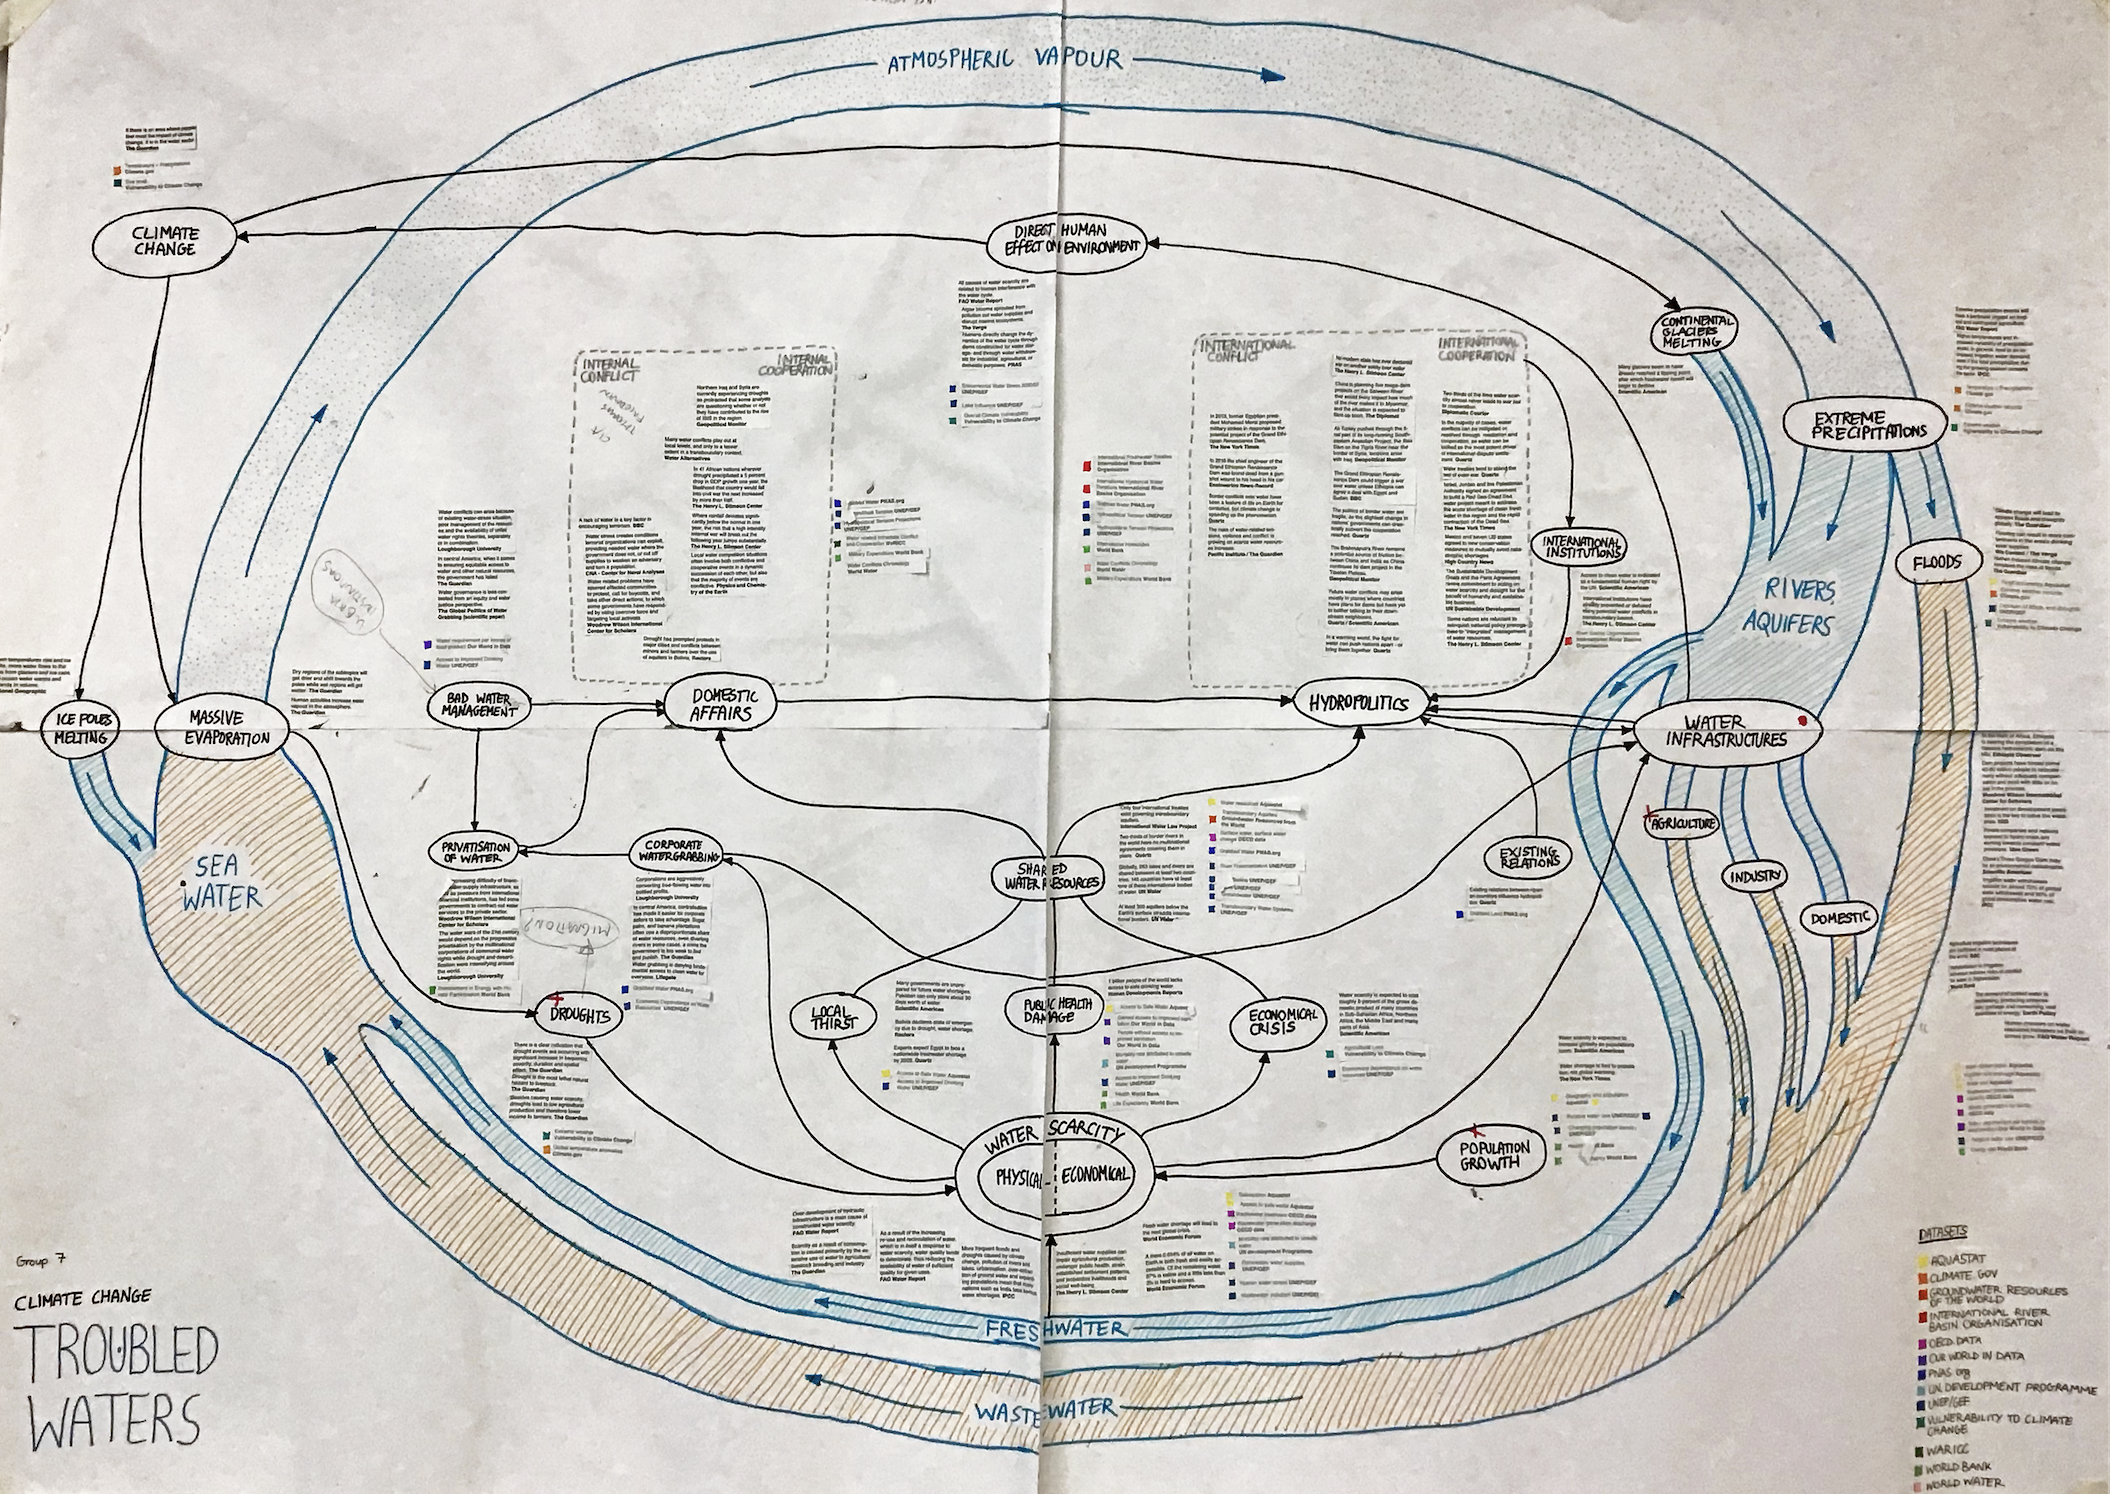
- General mapping of the statement about climate change, dataset (Pacific institute, world back, FAO aqua stat, UNEP/GEF).
- Analysis of data, general statement map
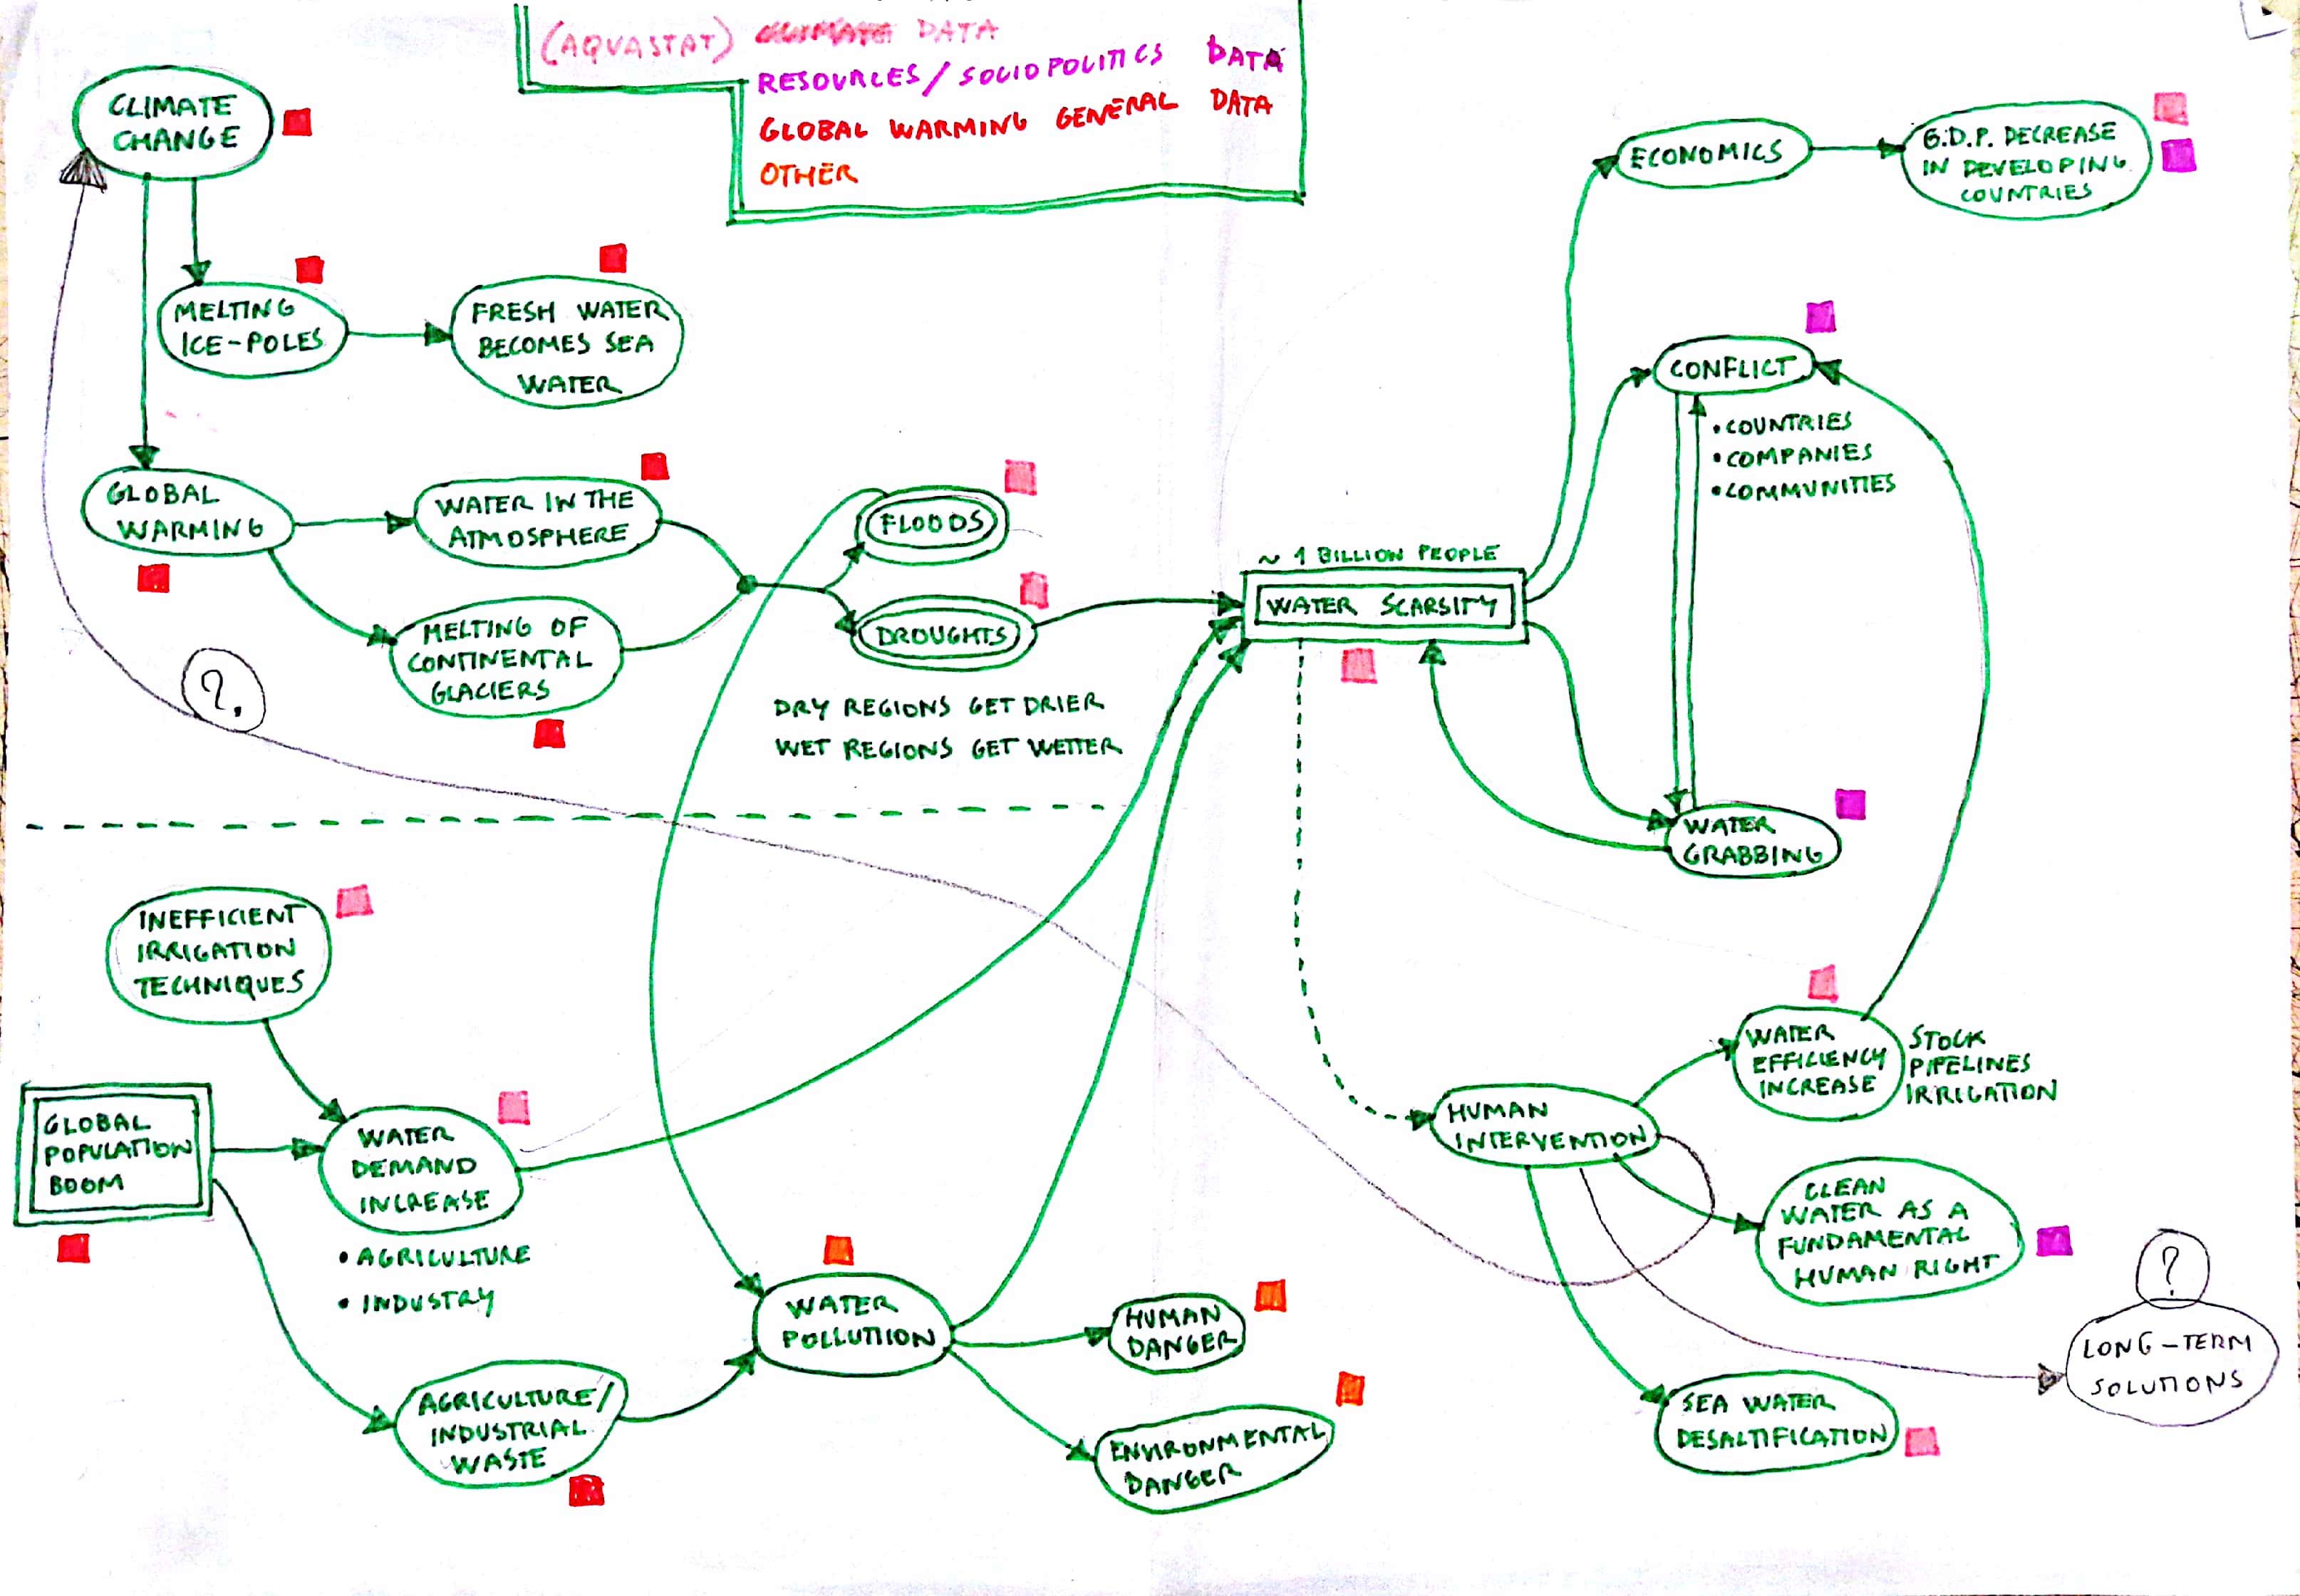
- Scheme and storytelling of filtered information, history with issues and data
- Sketches of aesthetic and synthetic examples, characteristics by category